Intelligent evaluation for cognitive skills
Researchers have been longing for solutions to improve the effectiveness of students’ learning for years, yet they have to get rid of the riddle of roadblocks of progress tracking, cost, quality of curriculum and intelligent access. Machine learning seems to be a promising game-changer towards these obstacles. Many studies aim to apply machine learning techniques to deliver a custom learning experiences in order to provide students with real-time feedback, suggestions, learning pathways and resources. One direction to dig in is to model students’ knowledge and calculate proficiency as a latent variable. This latent variable is updated over time based on the answer that students make when applying knowledge to solve problems. Of many methods, standing out are Item Response Theory (IRT), Deep Knowledge Tracing (DKT) and Bayesian Knowledge Tracing (BKT). BKT is an extremely popular method in student knowledge modeling, and over a long period of development, there were many modifications put into BKT to improve its quality. Currently, BKT is widely used across the United States in lots of technologically enhanced learning environments (TEL) or Intelligent Tutoring Systems (ITS) such as the Open Learning Initiative and the Open Analytics Research Service [1].
Edmicro is one of tech-based educational companies that have been applying machine learning algorithms to increase the quality of personalized learning and enhance student’s learning experiences. Edmicro applies BKT as a tool to assess students’ level when they practice one knowledge unit, by using preset rules or algorithms to shape content to the needs of an individual student, give the student just-in-time suggestions and learning roadmap. However, in Edmicro, BKT is slightly adjusted to meet our accuracy requirements and database condition, we will mention that on the latter part of this article after a brief introduction of BKT method.
Bayesian Knowledge Tracing Introduction
BKT method was introduced in 1955 by Corbett & Anderson with the intention of modeling students’ knowledge. It computes the likelihood that a student has learned a skill. In other words, BKT calculates and infers the mastery level that the student attains when learning one knowledge unit. It uses 4 main parameters to calculate the mastery score every time the student answers questions. Four main parameters are described below:
- Initial probability of knowing – p(L0)
- Probability of transmitting from unknown to known – p(T) or p(Transmit)
- Probability of applying a known skill in a wrong way to solve the problem/question – p(S) or p(Slip)
- Probability of guessing the answer correctly – p(G) or p(Guess)
The initial probability p(L0) describes the level of a student knowledge for one skill from the beginning. The higher it is, the faster the student will master the skill and there is also a higher chance that the student already knows the skill. When the student answers more correct questions, the probability that they master the skill will also increase. On the other hand, when the student makes wrong answers, the reason can be either Slip or Guess. P(Slip) shows the probability that the student knows the skill but fails to produce a correct answer while p(Guess) describes the chance that the student does not know the skill and only depends on luck to answer the question.
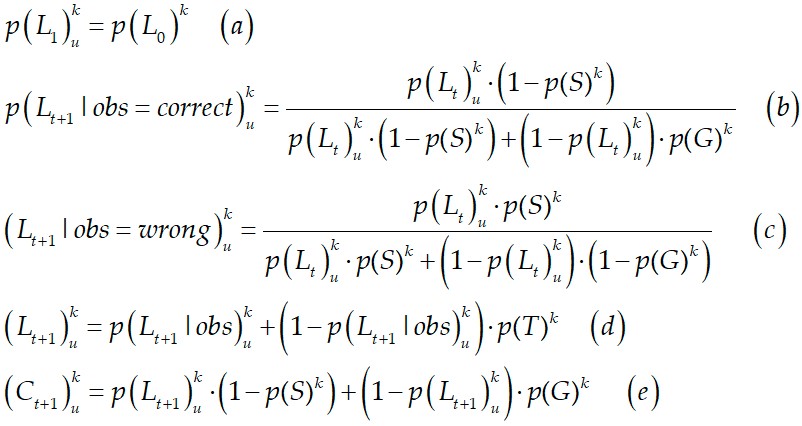
Equations used in BKT are shown below from (a) to (e). At the start, the probability of student u mastering skill k is initialized to p(Lo). Equation (b) computes the mastery point when the student answers a question correctly, otherwise equation (c) is used. Equation (d) is to update the probability of skill mastery. Equation (e) is to calculate the probability that the student applies the skill to a future question appropriately.
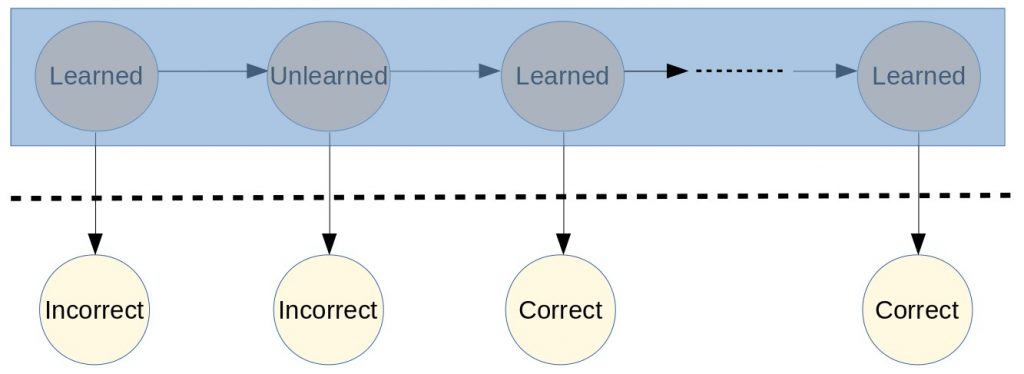
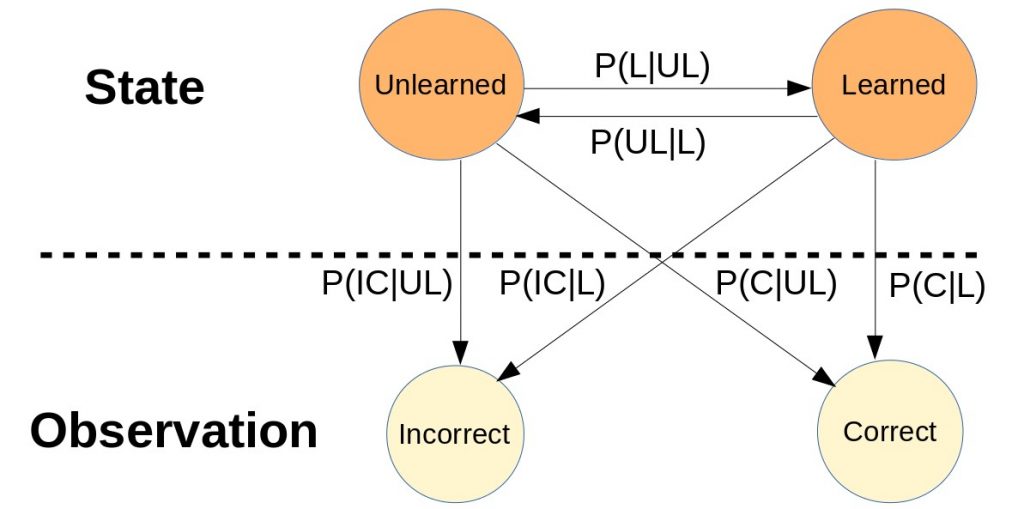
Under the hood, BKT uses Hidden Markov Model (HMM) to build up the model and train the parameters for each student’s database. HMM is basically a statistical Markov model in which the states are hidden (figure 1). Figure 2 shows an HMM with information on transition probabilities from one state to another state and emission probabilities from state to observation. With the HMM applied in BKT, the state (S) is either ‘Unlearned’ or ‘Learned’ and they are all hidden while the observation (O) is the answers that students made from the questionnaire. Observation is either ‘Correct’ or ‘Incorrect’.
In general, Markov process is the transition from one state to the next state, in which the next state depends only on the current state and the transition probability. With a chain of observations (for example: correct, correct, incorrect, correct, incorrect, etc.) we input them into HMM and use algorithms (Baum-Welch, Gradient Descent, etc.) to train the model and finally obtain the probability pack used in HMM (transition probabilities and emission probabilities). In the training process, the model will converge to the point that the log-likelihood delta is less than a fixed threshold pre-determined. The quality of the trained model is then evaluated by applying model over a test chain of observations, the accuracy rate, AIC and BIC values are considered to assess the trained model. After that, the 4 parameters of Bayesian Knowledge Tracing is computed by using this trained probability pack of HMM.
Bayesian Knowledge Tracing Implementation
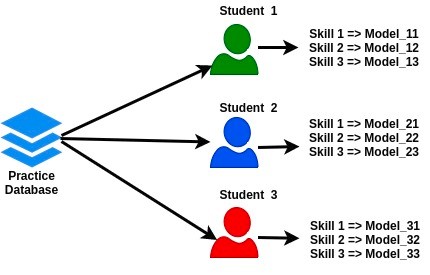
In the standard implementation, BKT processes data which focuses on skill parameter only [2]. Meaning that, with a data of many students, it still creates a common model for each skill used for all that student. Edmicro used personalized BKT to assess the student’s mastery skills, in which BKT is applied to each student with their own database of each skill. By this way, it can enhance the accuracy and individualize the model’s parameters for each student (figure 3). This idea of applying has been suggested for quite a long time by many studies [3]. Data is collected from 140,000 students using Edmicro’s learning system with nearly 3900 skills from elementary school to high school. BKT model will be re-calculated in every new practice that students made, so the output mastery point is always updated and reflect the current ability of the student in one specific skill.
Also, BKT assumes by default that, the student never forgets the knowledge that they already learned. When the student masters the skill, they will master it forever. The probability of going back to “Unlearned” from “Learned” is always zero. So, in figure 2, P(UL|L) = 0, and when P(L) reaches 1, it will never go down again no matter how many wrong answers the student makes after that point. About this issue, Edmicro believes that except for some special cases like gifted people, forgetting is a normal process in people’s minds. Over time, the mastery degree of one skill will be decreased and the student needs to practice regularly to maintain and keep their skills unchanged. We use the theory of forgetting curve that will decrease the mastery score over time if the student does not attempt the skill within an amount of time [4]. The forgetting curve is basically an exponential decay function (figure 5) used to update the knowledge level. Edmicro uses equation (f) as the decay function where constant = 0.1 [5] . One more thing, we set the master threshold to 99% in order to avoid the problem of perfect 1 mentioned above, so that wrong answers from the student always have influence to the students’ master score.

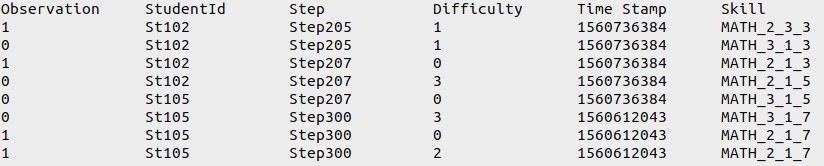
Besides, BKT does not include the differences of questions. It considers every question equally no matter how hard or easy the question is. So, in order to qualify the student ability more properly, we add one more column in the training data to take into account ‘question difficulty’. A reward point will be added to the mastery point if students can solve the difficult questions, otherwise, if students can not answer the difficult question, the percentage of knowledge review for this student will increase. The data format used for training process now is like figure 4.
Graph and Data Analyze
The convergence line from figure 6 describes the training process of HMM for one student with skill “Mechanical Motion Calculation”. In every iteration of training, it calculates the log likelihood delta from the current model to the previous one. The training process only stops when the delta is less than a predefined threshold, in this case, the threshold is 0.0001. At iteration 1, the delta was quite high, around 2, but over training process, it decreased to 0.25 and then approximates to 0 at iteration 15 and the training process stopped right after that.
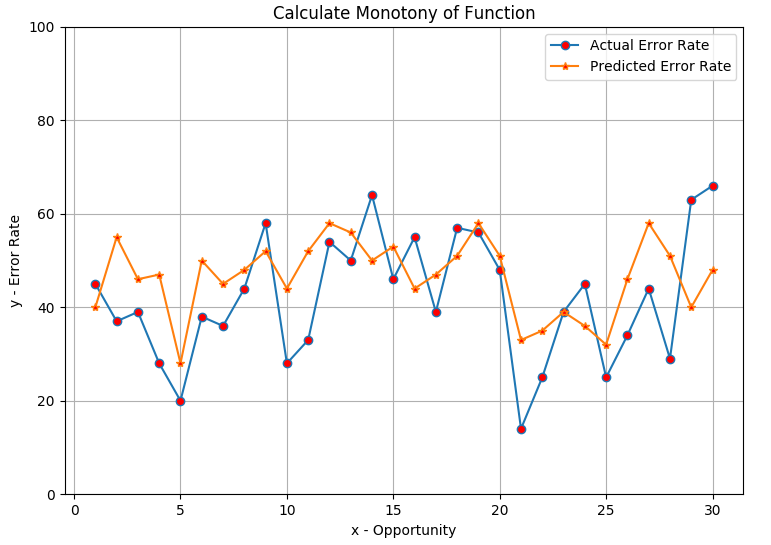
Look at the learning curve in figure 7, we have the error rate over opportunity (chance to answer questions) for the knowledge component ‘Calculate Monotony of Function’. The blue line is the actual error rate of students while the orange one is the predicted line from the trained model. From the graph, at opportunity 10, around 65% of students answered the question wrong while the model predicts the error rate is 53%. If 2 lines are close to each other means the model is trained pretty well and vice versa. Another thing, over the graph, we also see at which question most students have problems with and which questions are too easy for them. This type of information can be used to assess and improve the quality of the question database afterward.
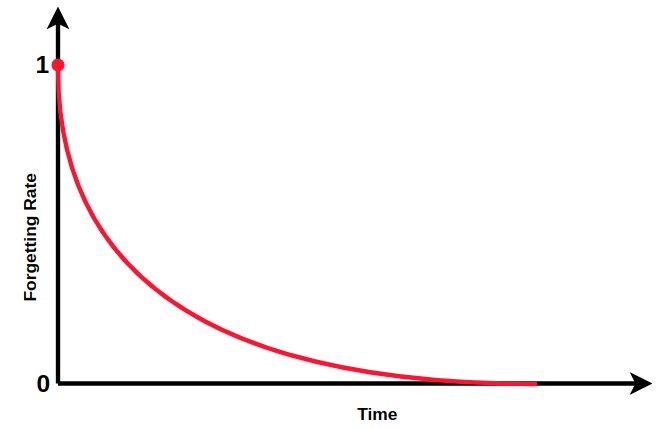
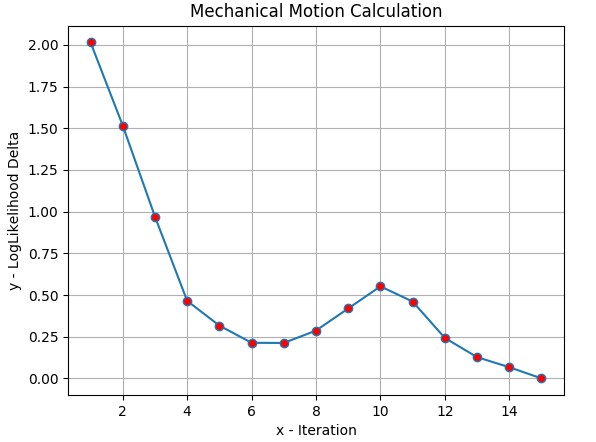
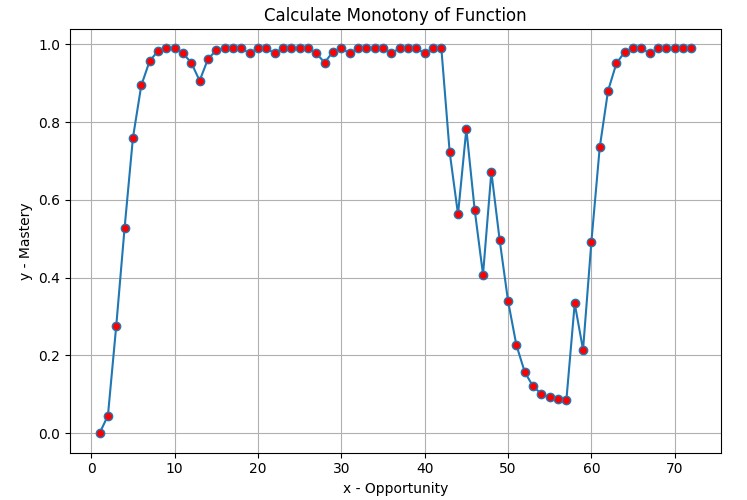
Figure 8 shows the mastery score over opportunity for one student with the skill “Calculate Monotony of Function”. The master value here already includes the forgetting ratio and reward point rules. From the graph, at opportunity 4, the student’s mastery point is 58%, then after some more practice, the score increases to 99% at opportunity 10, but from the opportunity 43, the mastery score decrease very fast. It looks like from the beginning of the skill practices, the student gradually understood the knowledge and knew how to use the knowledge to find the correct answer of questions but then the student can not keep their good chain and fails to solve the problem. The mastery graph will be updated over time for every new question answered. Based on this graph, the tutoring system will know right away where and when the student encounters difficulties and promptly shifting lesson flow or recommend reviewing materials before continuing.
Heat graph in figure 9 depicts how the student’s mastery score changed when practising 5 skills. Each skill has 33 questions. All these 5 skills belong to one category “Derivative Application”. By looking at the heat map, we can see how the student can handle this “category-skill”. The dark blue color means low mastery score while bright green color represents high score. It seems that this student did pretty well on “Find Intersection”, “Calculate Monotony of Function” and “Find Local Maxima and Minima” but still needs more practice on “Convert to a Quadratic Equation” to be proficient in the category skill.

Again, applying machine learning to personalize students’ learning has proven itself for years in providing the best possible learning experiences for learners and shaping the effectiveness in comprehensive understanding of students. Students can get the hang of skills quickly and retain the knowledge for a long period, which will reduce the learning cost in the long run. Edmicro’s system implements both BKT and IRT to assist the learning process of the students. BKT is mostly used in the self-study practice while IRT is mainly for school-education type. The trained model built from BKT or IRT not only traces and updates students’ skills over time, but also can be used to develop an intelligent recommendation system and curriculum design that applied to each student based on their personal needs and ability of acquiring knowledge.
References
[1] OARS: exploring instructor analytics for online learning. Bassen, J., Howley, I., Fast, E., Mitchell, J. and Thille, C., 2018.
[2] Yudelson M.V., Koedinger K.R., Gordon G.J. (2013) Individualized Bayesian Knowledge Tracing Models. In: Lane H.C., Yacef K., Mostow J., Pavlik P. (eds) Artificial Intelligence in Education. AIED 2013. Lecture Notes in Computer Science, vol 7926. Springer, Berlin, Heidelberg.
[3] Lee, Jung In, and Emma Brunskill. “The Impact on Individualizing Student Models on Necessary Practice Opportunities.” International educational data mining society (2012).
[4] Nedungadi, Prema, and M. S. Remya. “Incorporating forgetting in the personalized, clustered, bayesian knowledge tracing (pc-bkt) model.” 2015 International Conference on cognitive computing and information processing (CCIP). IEEE, 2015.
[5] Pelánek, Radek. “Application of time decay functions and the elo system in student modeling.” Educational Data Mining 2014. 2014.